(An important note: standard deviations and effect size were purposely left out of the reporting of the statistics for ease of reading)
An Overview
When the conversation began to build and people started to take sides, I decided that I wanted to investigate the 1992 Olympic Men’s Basketball team, affectionately known as the Dream Team, and see if I could come to some kind of statistical conclusion about whether or not the 2012 team stacked-up in a head-to-head contest.
The conclusions that I will draw will say nothing of what would happen, since we do not have a time machine (at least I do not) and as such we cannot see what would actually happen if the squad in 2012 met the 1992 version of the Hall of Fame members of the Dream Team.
Instead, my goal is to look at the statistics of the game, the numbers that are used to generate fantasy leagues and talk about the hierarchy of all-time greats with a standardized precision. I will utilize the statistics from Basketball-Reference.com, which is a database of extensive statistics that are wonderfully robust for the time periods I am investigating.
I will use statistical tests to compare the two teams as a whole, and as well a position-by-position analysis. For the sake of an objective analysis, I will not be taking into account the career statistics or career accolades of the much-lauded 1992 Olympic Team. Also, I will be omitting the statistics of rookie Anthony Davis from the 2012 team (because he does not have professional basketball numbers) in addition to Christian Laettner of the 1992 team, for the same reason. I will be using statistics from the year immediately preceding the Olympics games for all of the players included in the analysis, with the notable exception of Magic Johnson. I will use his career numbers, as 1991-1992 averages were not available. I had, briefly, considered using his 1990-1991 numbers, but they would be many months removed and felt that the career numbers were a more conservative estimate of his numbers (as his career numbers reflect comparatively) and a better representation of his contribution at the time.
The teams will be evaluated on a variety of variables. I will not take into account point differentials during Olympics wins because of the difficulty presented in comparing the other national teams. The PER rating (the per minute efficiency rating of a player) as well as true shooting percentage will be used in conjunction with a variety of statistics (averages over the year leading up to the Olympic games) taken from Basketball-Reference.com: points per game, assists per game, rebounds per game, steals per game, blocks per game, free throw percentage, field goal percentage, offensive rebounds per game, defensive rebounds per game, three-point field goal percentage, and defensive rating. I will break down the comparisons in the following three ways: team, front court, and back court.
What will follow will be a statistical analysis of the Olympic squads from the Dream Team forward. While statistics do not reveal everything, there is something to be said about an objective, comparative analysis in the only way that is possible: statistics. The intangibles of the game are what make watching it so great. This is an exercise in combining two great loves: statistics and basketball.
What Does It All Mean
For many of the readers, I imagine statistics are simply that awful word-based math you had to sit through during school. Perhaps mentioning statistics conjures the famous Mark Twain quote: “There are three kinds of lies: lies, damned lies, and statistics.” For the sake of this analysis (and subsequent analysis), I will be using group comparisons. I had contemplated the variety of ways with which I could talk about the data and the most pertinent was using each Olympic year as its own group and drawing conclusions from there.
What we are interested in when considering group comparisons is whether or not a group is distinguishable from another group in a statistically significant way. This is to say that if there were no labels that we would be able to say one group was larger or smaller than another group in a meaningful way and not just due to chance. So when I talk about the mean values (the averages) of any particular statistic, I will be sure to differentiate purely numerical differences and statistical differences. Since I know that statistical analysis is about as interesting as pulling teeth for most fans, I will try and rephrase everything in more palatable terms. Much of what we love about fantasy sports is due to statistics. I love using statistics to examine basketball because it allows me a unique perspective into the game that is often only afforded to basketball-operations types.
The first step when considering so many variables and groups is to perform a multivariate analysis of the data. There are multiple dependent variables and we want to guard against statistical errors, so performing due diligence toward that end did indeed yield a significant multivariate effect at the p < .001 level. This means something and nothing all at once.
Take a breath.
What this means is very simple: there are differences between the Olympic teams and that difference is statistically significant. The reason why it doesn’t tell us much is that teams are different and how they are different is not revealed in a multivariate analysis; instead, we know to look further and we shall. In addition to a multivariate analysis, I was curious whether or not there were factors that hung together when considering teams that won a gold medal since the 1992 Dream Team.
A factor analysis, in the simplest terms possible, is an attempt to understand how variables hang together. So when I say that the top three factors account for 67.37 of the variance, I am certain that means very little. The number goes over 80 percent when including two more, much smaller, factors.
So the first factor is comprised of the following: RPG, BPG, ORPG, DRPG, HGT, WGT (38.940%). This looks a lot like a defensive statistic, which would work well to describe a power forward or center. The second factor is comprised of these variables: PER, OFFRAT, PPG (16.384%). I would venture to say this factor is very much a scoring statistic, which might fit very well with a shooting guard or small forward. The final factor was comprised of these: TSPER, FGPER, USAGEPER (12.046%). This looks suspiciously like a leadership statistic that would fit well with a point guard (or the newly minted point forward).
What the deuce does that mean? Nothing, really. For a statistician such as myself, I might be inclined to take my analysis further utilizing these new categories, but I won’t. For the casual basketball fan, it means that there are definitely three factors to a great team: defense, offense, and leadership.
Alright, enough with the explanations. Let’s get to the statistics.
Age
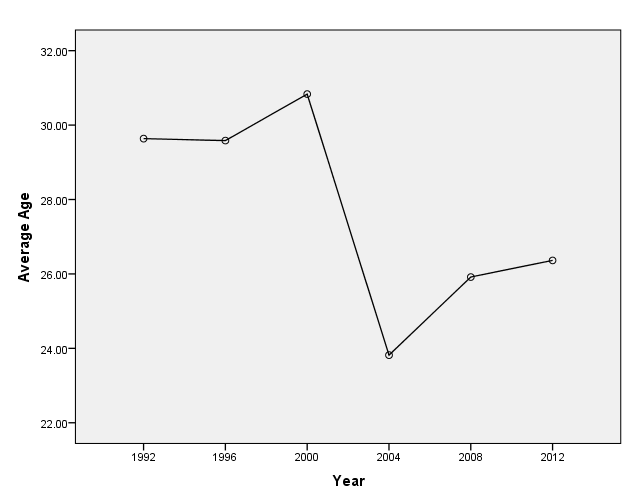 The mean ages (in years) for the Olympic teams were as follows: 1992 (29.64), 1996 (29.58), 2000 (30.83), 2004 (23.82), 2008 (25.92), and 2012 (26.36). There was a significant difference in mean age, F(5,63) = 7.48, p < .001. There were also linear (p < .001) and cubic (p = .07) trends, which would suggest a gradual decrease in age over time punctuated by a stark decrease in 2004 (the only year since 1992 that the US did not win a gold medal).
How were they different?
The 1992, 2004, 2008, and 2012 teams all had significantly lower ages than the 2000 team. What about the question of whether or not the 2012 team was younger than the 1992 team. Numerically, this is true. However, there was no statistical difference in age between these two teams. This, in plain terms, means that we cannot be certain that the difference in the ages is not due to chance.
Steals

Steals might seem like an insignificant statistic when considering the whole of a team, but there is something to be said about how defensive pressure impacts the game. The means for each Olympic year were as follows: 1992 (1.86), 1996 (1.58), 2000 (1.14), 2004 (1.42), 2008 (1.38), and 2012 (1.36). The only significant difference was between the 1992 team (which had the highest average steals) and the 2000 team (which had the lowest average steals). There was also a significant linear trend (p = .040), which would seem to imply a steady decrease in average steals since 1992.
Defensive Rebounds

Unfortunately, there was no real difference in defensive rebounds between the different Olympic teams. Based on the scale of the graph you might be inclined to think otherwise, but there was nothing significant about the different years. For numerical sake (because we know I love numbers), here are the average means for each year: 1992 (6.23), 1996 (5.47), 2000 (4.96), 2004 (5.33), 2008 (5.27), and 2012 (5.11).
Blocks
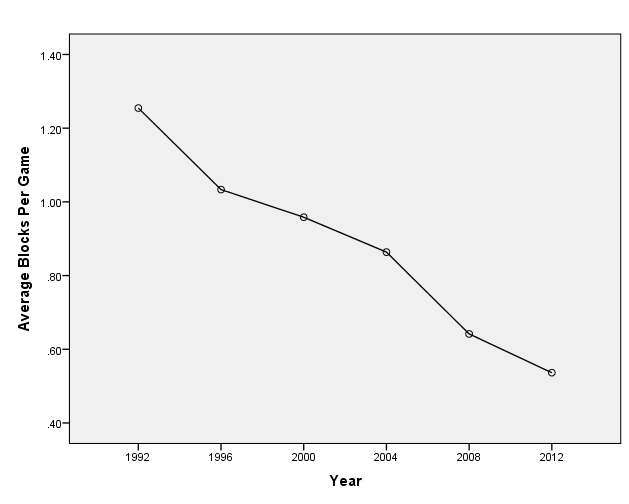 Another defensive statistic that certainly looks like it decreased over time. While there were no significant differences between groups, there was indeed a significant linear trend (p = .037) that would certainly suggest a decrease in average shots blocked from 1992 through 2012. To better visualize the data, the means were as follows: 1992 (1.26), 1996 (1.03), 2000 (.96), 2004 (.86), 2008 (.64), and 2012 (.54).
Free Throw Percentage
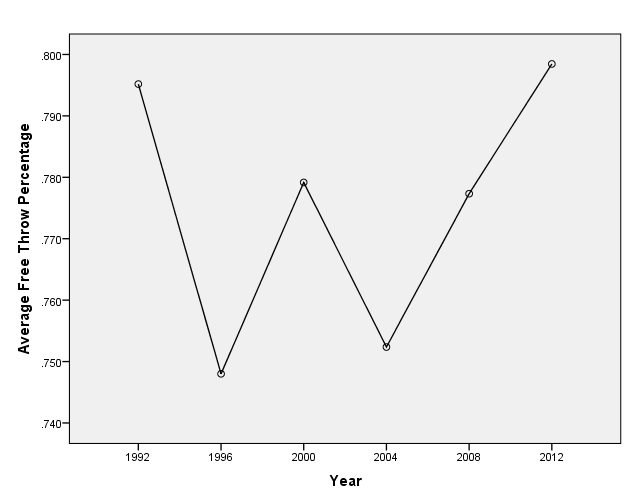
The graph would seem to suggest that there is a polynomial trend at work here, but that is not the case. There were not significant differences between Olympic teams. However, because I know how much you love numbers, here are the averages by year: 1992 (79.5%), 1996 (74.8%), 2000 (77.9%), 2004 (75.2%), 2008 (77.7%), and 2012 (79.8%)
Defensive Rating
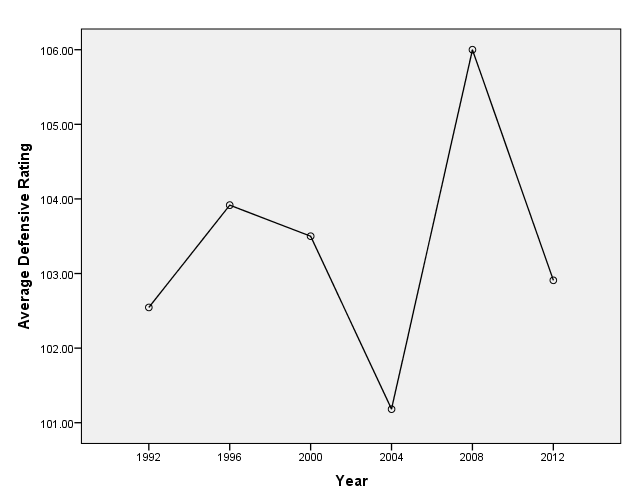
The Defensive Rating statistic is based on how many points were allowed per 100 possessions (The lower the number, the better the defense.) There were not significant differences between any particular teams, but there was a 4th order trend (p = .023) that would seem to suggest that at least teams were different enough from the predicted trend that they stood out (1992, 2004, and 2012). However, this does not tell us anything about how the teams are different from each other, only how they are different from an overall trend moving from 1992 until 2012. Moving from oldest to most recent, the average defensive rating by year was: 1992 (102.55), 1996 (103.92), 2000 (103.50), 2004 (101.18), 2008 (106.00), and 2012 (102.91).
Field Goal Percentage
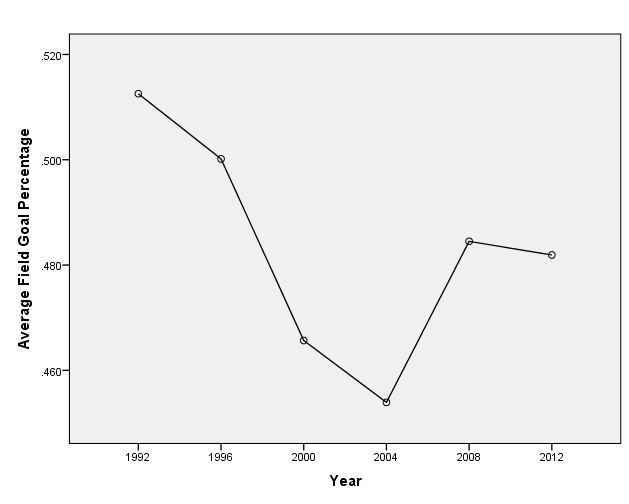
Field Goal percentage is how many shots were made relative to how many shots were taken. (This number excludes free throw percentage.) While there were no differences between the different Olympic teams, a quadratic trend was observed (p = .023) that shows a clear drop-off during the 2004 Olympics. It should be noted (again) that the 2004 team was the only team since 1992 not to win a gold medal. The averages by year were: 1992 (51.3%), 1996 (50.0%), 2000 (46.6%), 2004 (45.4%), 2008 (48.5%), and 2012 (48.2%).
Usage Percentage
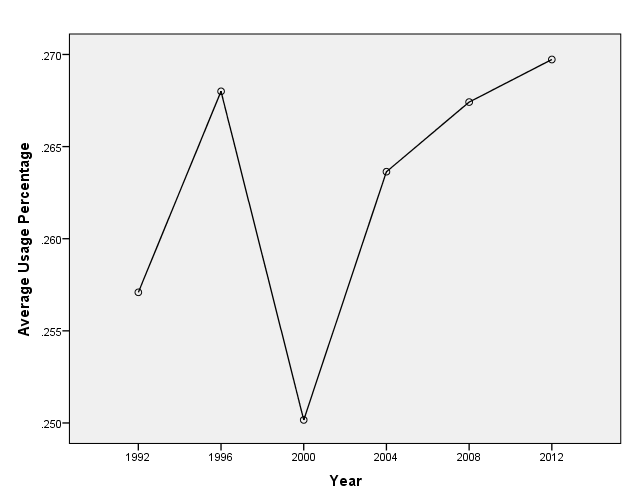
Usage percentage is an estimate of the percentage of team plays used by a player while he was on the floor. The graph would suggest much more is in play than the statistics reveal: there was nether an overall trend nor any differences between the groups. It is interesting to consider the averages from each team: 1992 (25.7%), 1996 (26.8%), 2000 (25.0%), 2004 (26.4%), 2008 (26.7 %), and 2012 (27.0%).
Height
Once again (thanks to the scale) there appears to be an overall trend of a small line-up, but there was neither a trend nor group differences to support that hypothesis. The means would suggest incremental differences (hence the lack of significance): 1992 (79.73), 1996 (79.75), 2000 (78.83), 2004 (78.91), 2008 (78.50), and 2012 (78.46).
Offensive Rating
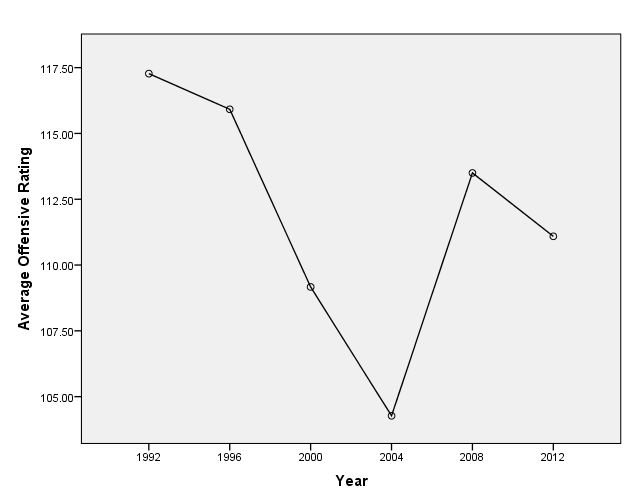
Offensive rating is the points produced per 100 possessions. There were indeed significant differences between the Olympic teams, F(5,63) = 5.54, p < .001. The 2004 team (109.17) had a significantly lower offensive rating than the 1992 team (117.27), the 1996 team (115.92), and the 2008 team (113.50). The 2000 team (109.17) and the 2012 team (111.09) were not different from any other group. There was as well a linear (p = .014) and quadratic (p = .002) trend, which would suggest a gradual decrease in offensive rating as well a dramatic dip in 2004.
Weight

Yet another statistic that was not meaningful in terms of helping us differentiate between teams. The averages (in pounds) are pretty close: 1992 (217.91), 1996 (224.75), 2000 (209.75), 2004 (221.82), 2008 (219.42), and 2012 (216.27).
True Shooting Percentage
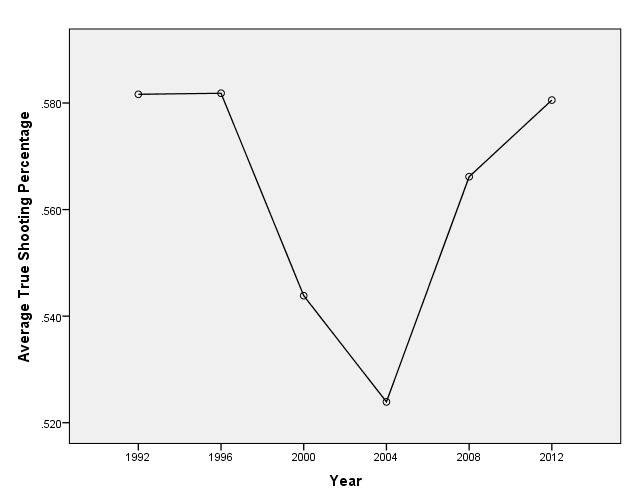
True shooting percentage is a measure of shooting efficiency that takes into account field goals, 3-point field goals, and free throws. There was indeed a difference in Olympic teams, F(5, 63) 4.895 , p = .001. The 2004 Olympic team (52.4%) was significantly lower than the 1992 team (58.2%), the 1996 team (58.2%), and the 2012 team (58.1%). The 2000 team (54.4%) and the 2008 (56.6%) were not significantly different from any other team. There was as well a quadratic trend (p < .001), which would seem to suggest a subtle drop-off in shooting efficiency in 2004.
Points Per Game

While the graph of PPG (Points Per Game) looks like there is something going on, I can assure you that there is nothing of statistical significance. The average points per game by Olympic year are as follows: 1992 (23.23), 1996 (22.21), 2000 (19.58), 2004 (19.79), 2008 (21.61), and 2012 (21.50).
PER (Player Efficiency Rating)

John Hollinger created the PER statistic that he described as thus: “The PER sums up all a player’s positive accomplishments, subtracts the negative accomplishments, and returns a per-minute rating of a player’s performance.” There was a statistical difference between Olympic years, F(5,63) = 2.901, p = .020. However, follow-up tests yielded no difference between individual groups. The means are as follows: 1992 (23.71), 1996 (23.28), 2000 (19.96), 2004 (19.76), 2008 (22.06), and 2012 (22.99). There was a quadratic trend as well ( p = .003) that would suggest a lull during the 2000 and 2004 teams in terms of efficiency ratings of the roster.
Assists

The Olympic teams were not significantly different from each other in terms of average assists per game. The averages for each year were as follows: 1992 (6.07), 1996 (5.18), 2000 (4.43), 2004 (4.18), 2008 (5.72), and 2012 (4.84)
Total Rebounds
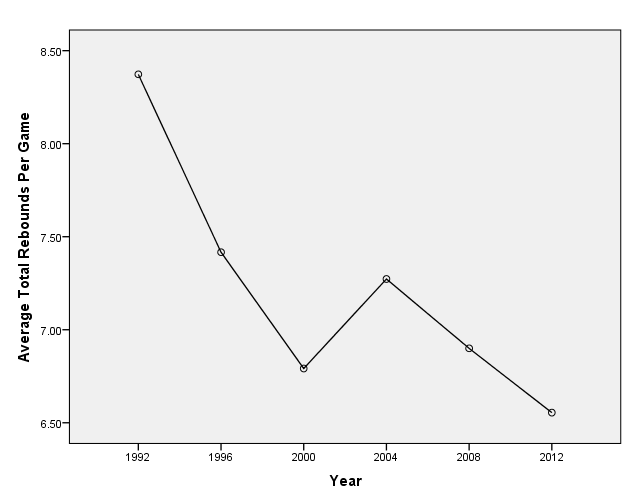
Sadly, total rebounds per game lacked a significant result as well. The averages were: 1992 (8.37), 1996 (7.42), 2000 (6.79), 2004 (7.27), 2008 (6.90), and 2012 (6.56).
Offensive Rebounds

It should come as no surprise that offensive rebounds lacked significant findings as well. The averages were as follows: 1992 (2.16), 1996 (1.96), 2000 (1.83), 2004 (1.96), 2008 (1.62), and 2012 (1.48).
Conclusions
Making sweeping conclusions about statistical data is part of the fun for me. Basketball is a team sport where one individual can dramatically change the course of a game. An Olympic team is, in theory, comprised of the best players at a given time. The only team that was significantly different than any other year was the 2004 team, which was the only team since 1992 to not win a gold medal.
Does that mean we can say that the other teams are better?
Not necessarily.
All we can really say is that the other teams were more similar to one another (teams that won a gold medal) than they were different from the 2004 bronze-medal winning team. I imagine that is slightly anti-climatic. The reality is that looking at averages of all positions created a homogenized sample.
 According to Forbes, 39.2% of psychology majors coming right out of college had an offer for a job somewhere. Of course, the knowledge and skill base of your average graduate is pretty variable, but it does speak to the utility of a background in psychology. Most companies, at some point or another, fall into a trap of the latest psychological-metric trend guaranteed to increase growth and productivity, or lend a hand to HR in order to hire the right folks.


